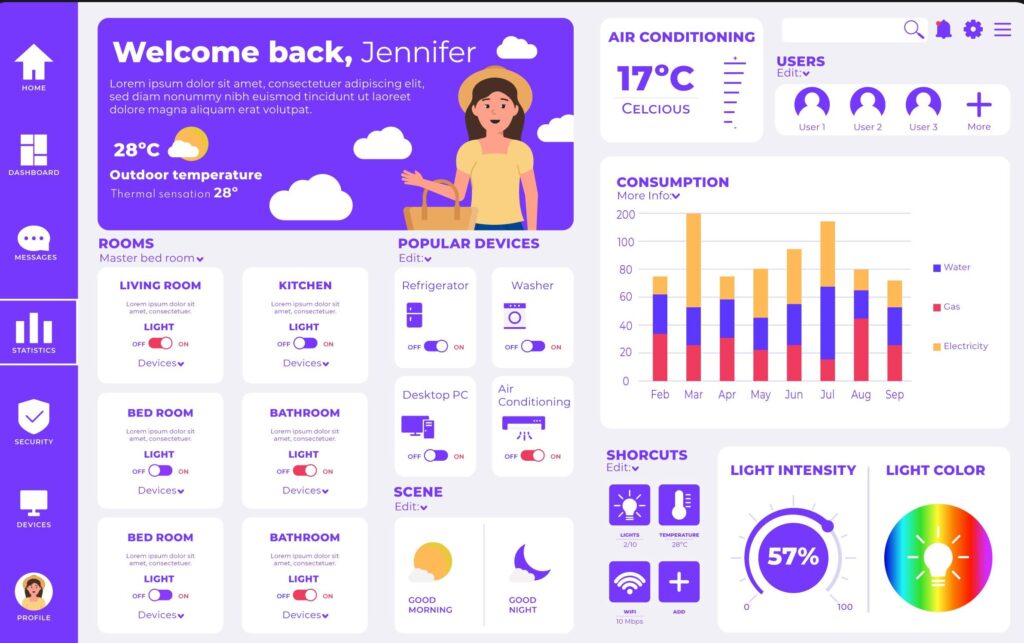
Business Intelligence & Visualisation
Transform Insights into Action
From executives to frontline teams, we turn complex data into actionable insights using interactive
dashboards and intuitive reports powered by leading BI platforms.

Why It Matters
A well-designed dashboard ensures:
Clarity and focus
present critical KPIs upfront
Faster decision-making
users spot trends and anomalies instantly
Empowered users
self-service BI reduces backlogs and reliance on analysts
Services
What We Offer
Dashboard Design
Craft intuitive, visually appealing dashboards using best practices: minimal clutter (5-9 visuals
max), mobile-responsive layouts, and consistent branding
Self-Service BI
Empower teams to generate and tweak their own reports with interactive filters, drill-downs, and
tooltips—fostering a data-driven culture
Embedded Analytics
Integrate dashboards seamlessly into your apps using embedded BI—boosting adoption,
streamlining workflows, and reducing context-switching
Data Storytelling
Provide narrative context through annotations, charts, and infographics—connecting dashboards to
insights, actions, and business strategy
Our Process
Understand
Define user roles and objectives.
Design
Create wireframes following F-pattern and hierarchy principles
Develop
Build dashboards with clean visuals, consistent fonts, and UI principles— Contrast, Alignment, Repetition, Proximity
Validate
Test with users, iterate based on feedback, and refine for clarity
Deploy & Scale
Roll out self-service models and embedded analytics to improve user outcomes


